
Team management analytics dashboard design concept
A team analytics dashboard direction for clearer project, workload, and collaboration decisions.


Team management tools get noisy when every project, message, task, and performance signal competes for attention. The concept focuses on giving managers a calmer way to understand team health without opening several separate views.
The challenge
A team dashboard has to support quick decisions without reducing the product to a wall of charts. Managers need to understand project movement, workload pressure, task flow, and collaboration activity at the same time.
The challenge was to make those signals readable enough for daily work while keeping the interface flexible for deeper analysis.
Concept direction
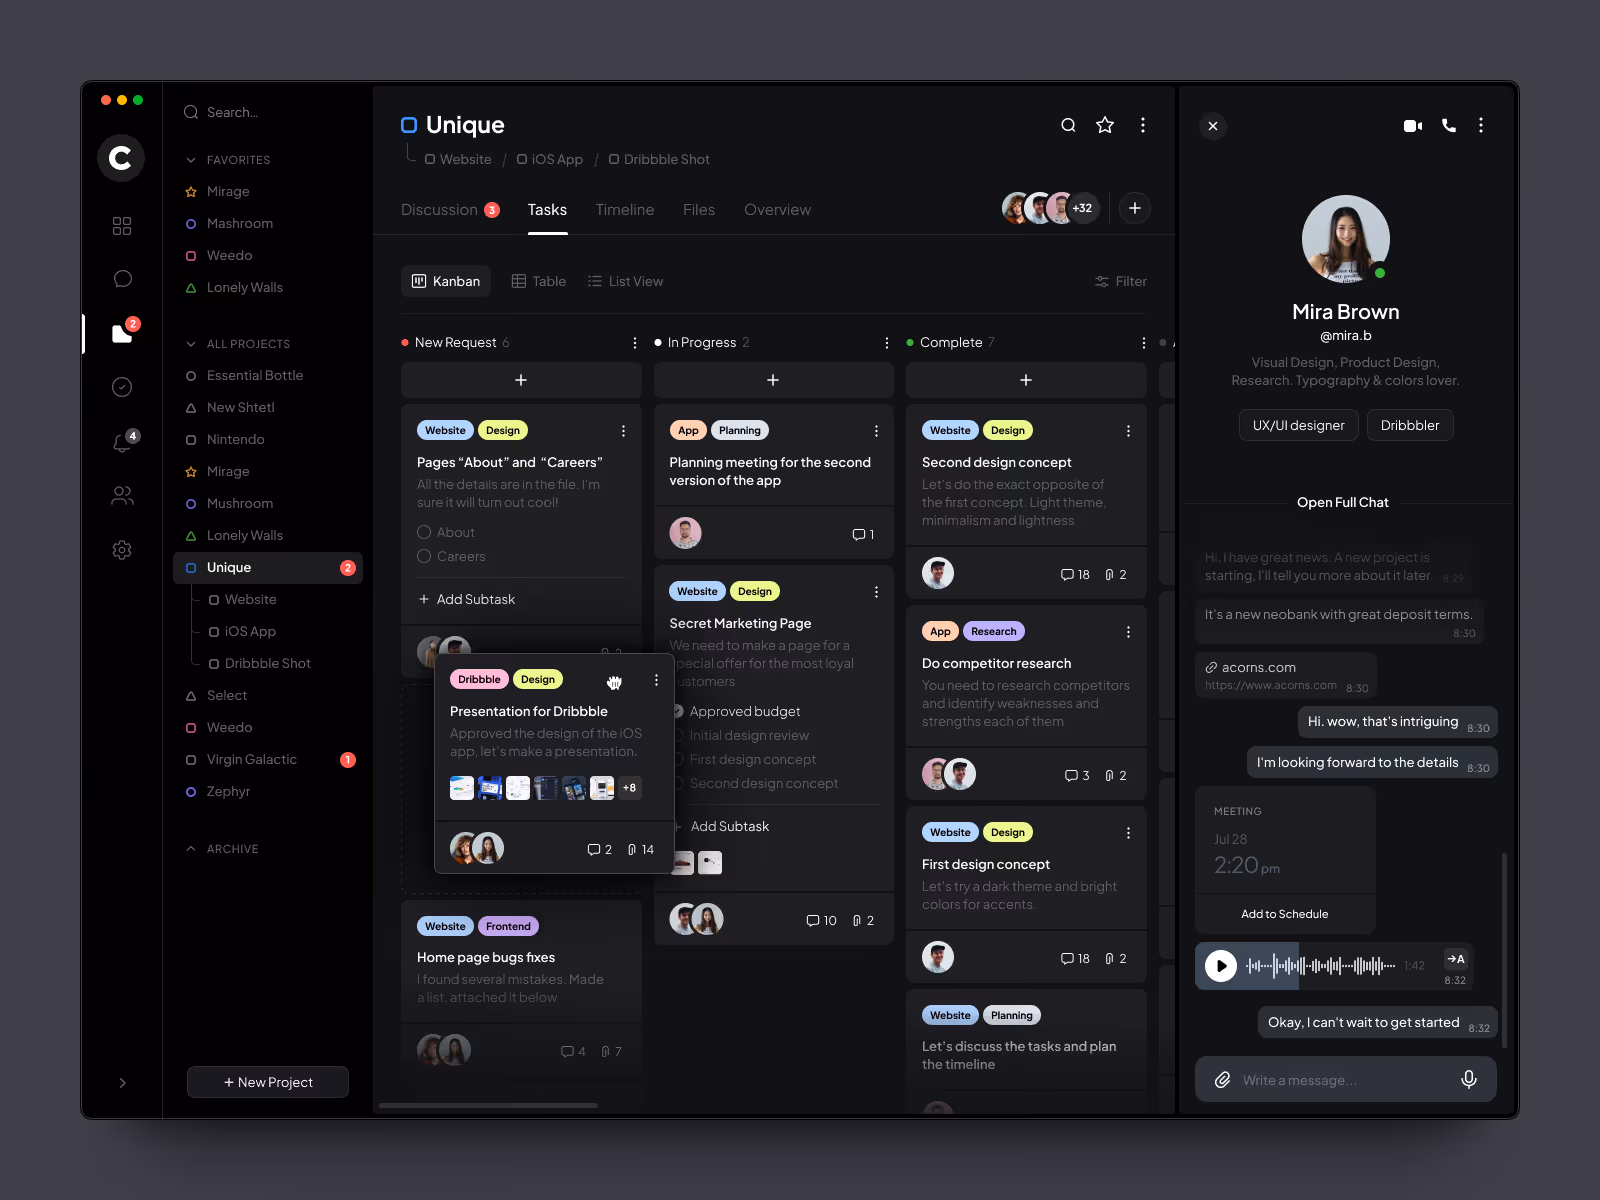
We shaped the dashboard around a management overview first. Project status, workload signals, task movement, and collaboration context stay close together so the user can understand what needs attention before going into details.
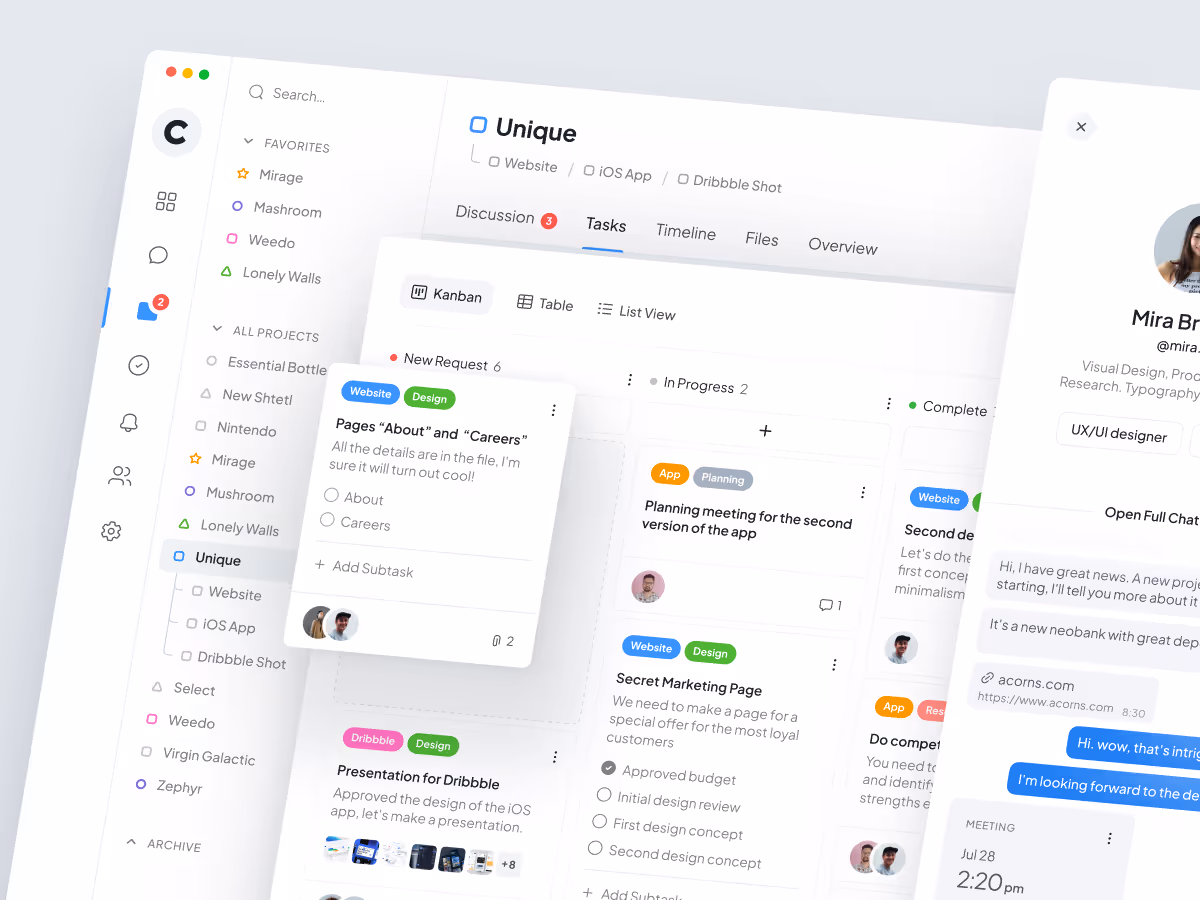
The visual language stays quiet because analytics products need trust. The interface uses clear hierarchy, readable cards, and structured data blocks to keep complex team information from becoming visual noise.
Scope of work
- Team analytics dashboard UX direction
- Project and workload overview
- Task and workflow organization
- Collaboration and activity signals
- Data hierarchy for management decisions
- Development-ready dashboard assets
Key decisions behind the concept
The main design decisions focused on making team data easier to compare during real management work.
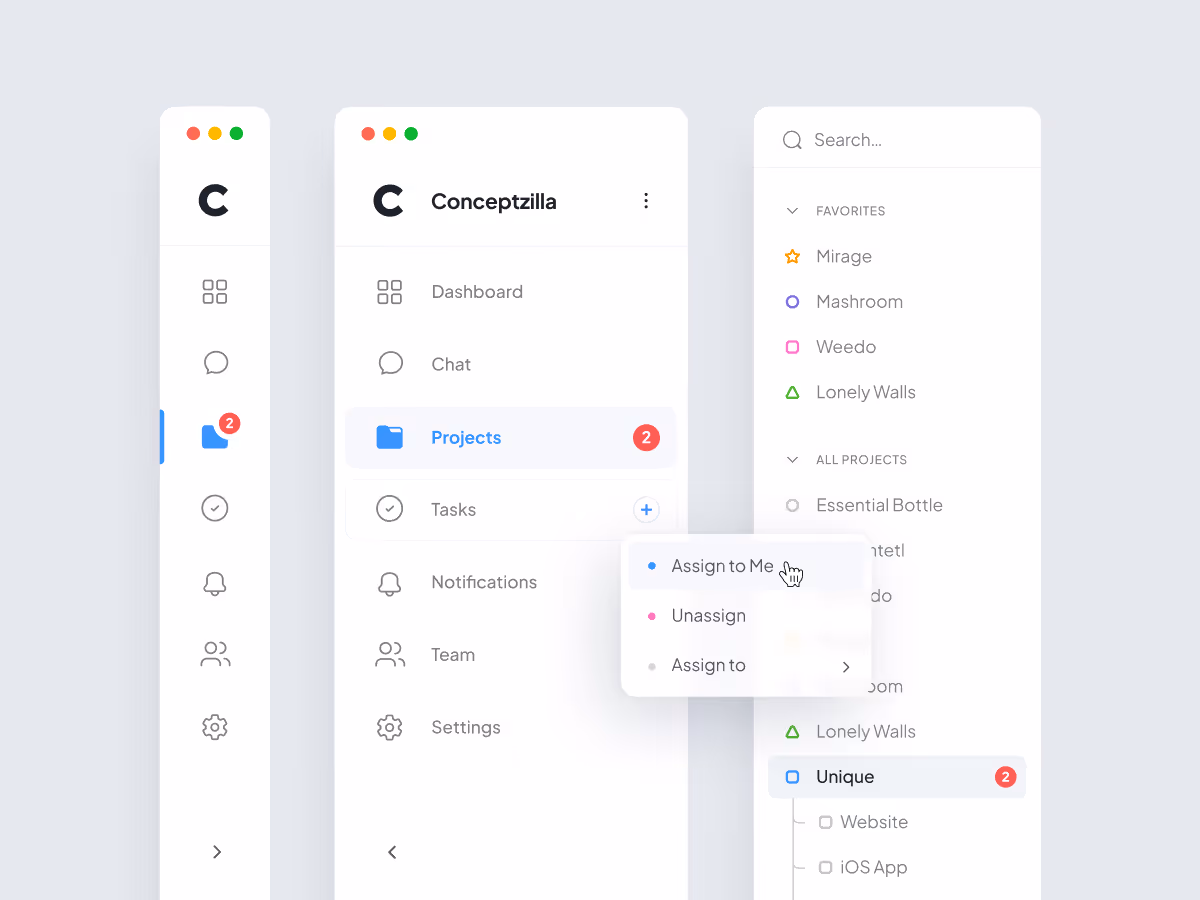
- Overview before investigation. The dashboard gives managers a clear first read of team status, then supports deeper views when a project or workload signal needs attention.
- Workload context stays close to project status. Capacity and project progress are treated as connected signals. This helps the interface show not only what is happening, but where pressure may be building.
- Collaboration data stays practical. Activity and communication signals are used to support decisions, not to create another layer of vanity metrics.
- Dense information stays visually calm. Cards, charts, and lists are organized so the dashboard can carry a lot of information without making the product feel heavy.
Concept outcome
The concept gives a product team a clearer direction for a management analytics dashboard. It shows which signals belong in the main view, how project and workload context can sit together, and where users should go next when something needs attention.
For a founder, product owner, or internal team, that clarity helps turn a broad analytics idea into a product structure that can be reviewed, discussed, and developed further.
Need a clearer product direction?
If your team needs to turn complex product data into a dashboard concept people can evaluate, start with a focused design direction.


