Cargo delivery dashboard
Cargo delivery work moves fast, so the dashboard had to make the important signals easy to see.


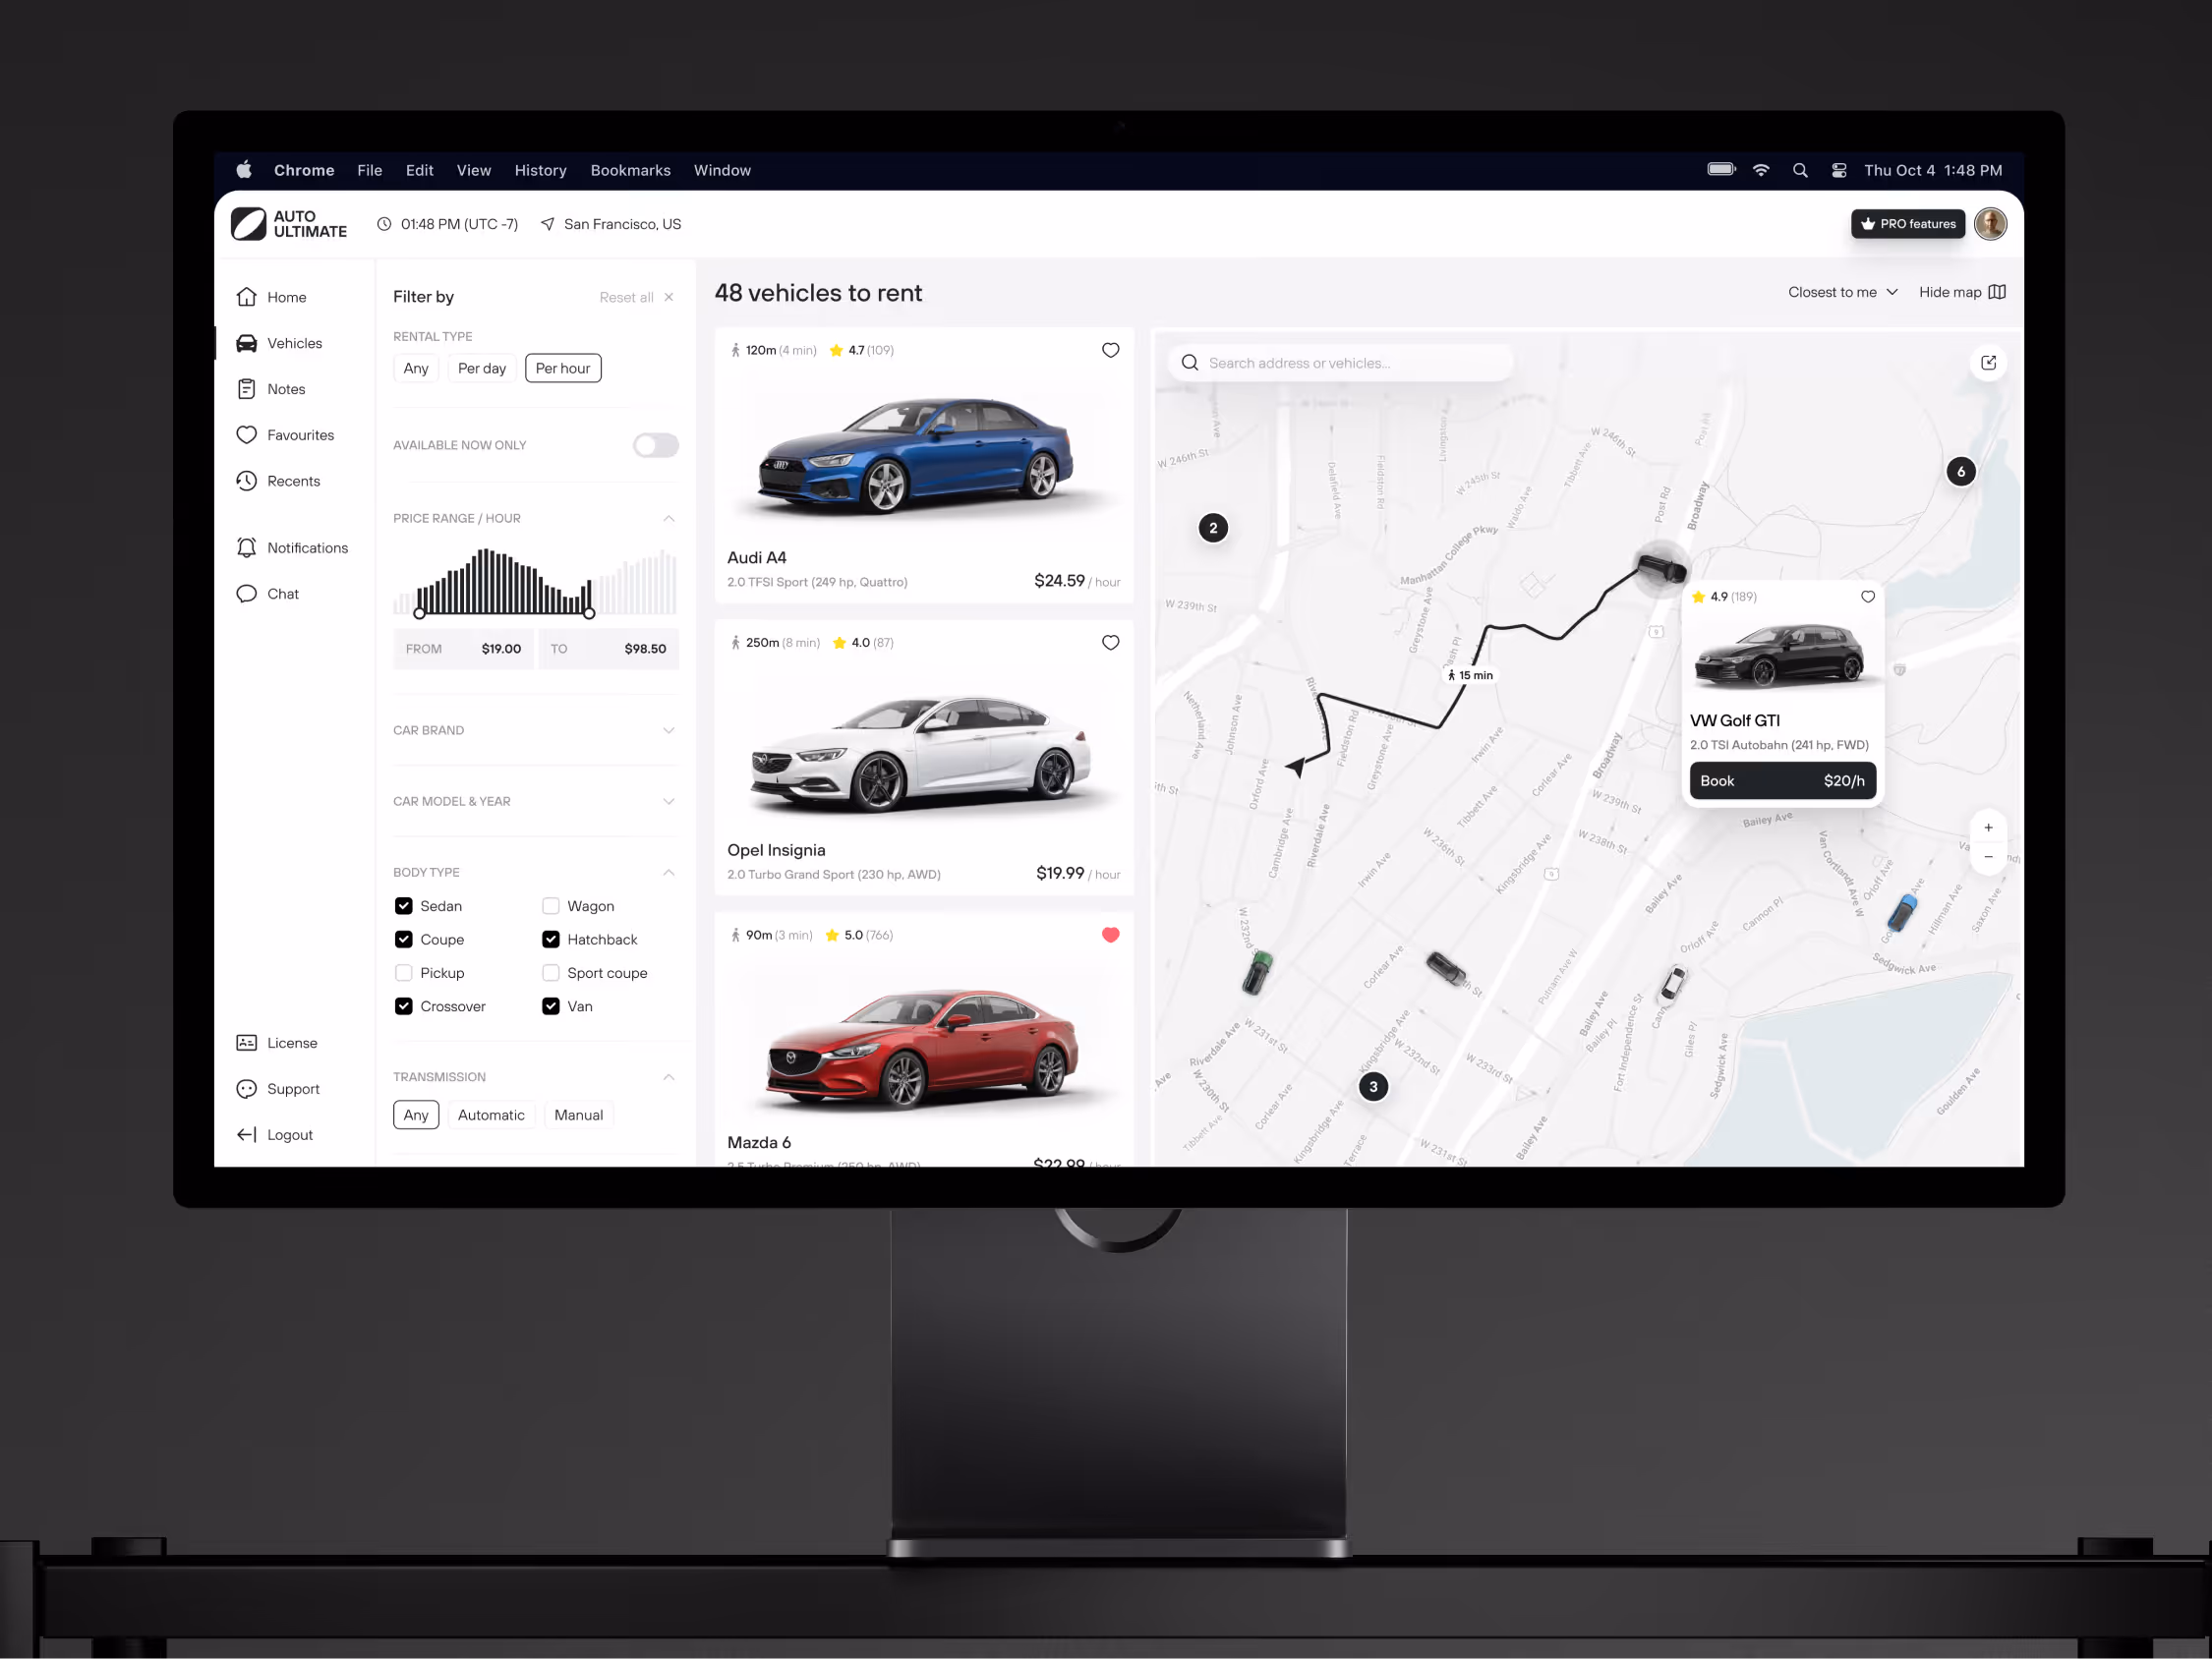
We designed the concept to bring routes, drivers, cargo details, and performance data into one operational view. The goal was to help an operations team read the state of delivery work without digging through scattered information.
The challenge
The project needed to make a busy delivery operation easier to read at a glance. Drivers, vehicles, routes, cargo details, delays, and daily workload all affect the same decisions, but they are often treated as separate pieces of information.
We focused on the moment when an admin or dispatcher needs to understand what is happening quickly: which route needs attention, which driver is active, what cargo is moving, and where workload pressure is starting to build.
Concept direction
We shaped the dashboard around an operational overview first. Driver details, vehicle information, license data, cargo status, route context, and performance numbers were grouped into a structure that can be scanned during active work.
The visual language stays restrained because logistics dashboards need density. We kept cards, tables, status areas, and analytics blocks clear enough to carry a lot of information without turning the screen into noise.
Scope of work
- Dashboard UX direction for cargo delivery operations
- Driver and vehicle information architecture
- Route and delivery monitoring views
- Performance analytics and workload signals
- Status and exception hierarchy
- Development-ready dashboard assets
Key decisions behind the concept
The main design decisions focused on keeping operational context close to the decisions an admin has to make during the day.
- Driver context stays close to route data. We kept driver, vehicle, license, cargo, and route details in the same working context. That makes each delivery easier to understand without forcing the user to jump between disconnected screens.
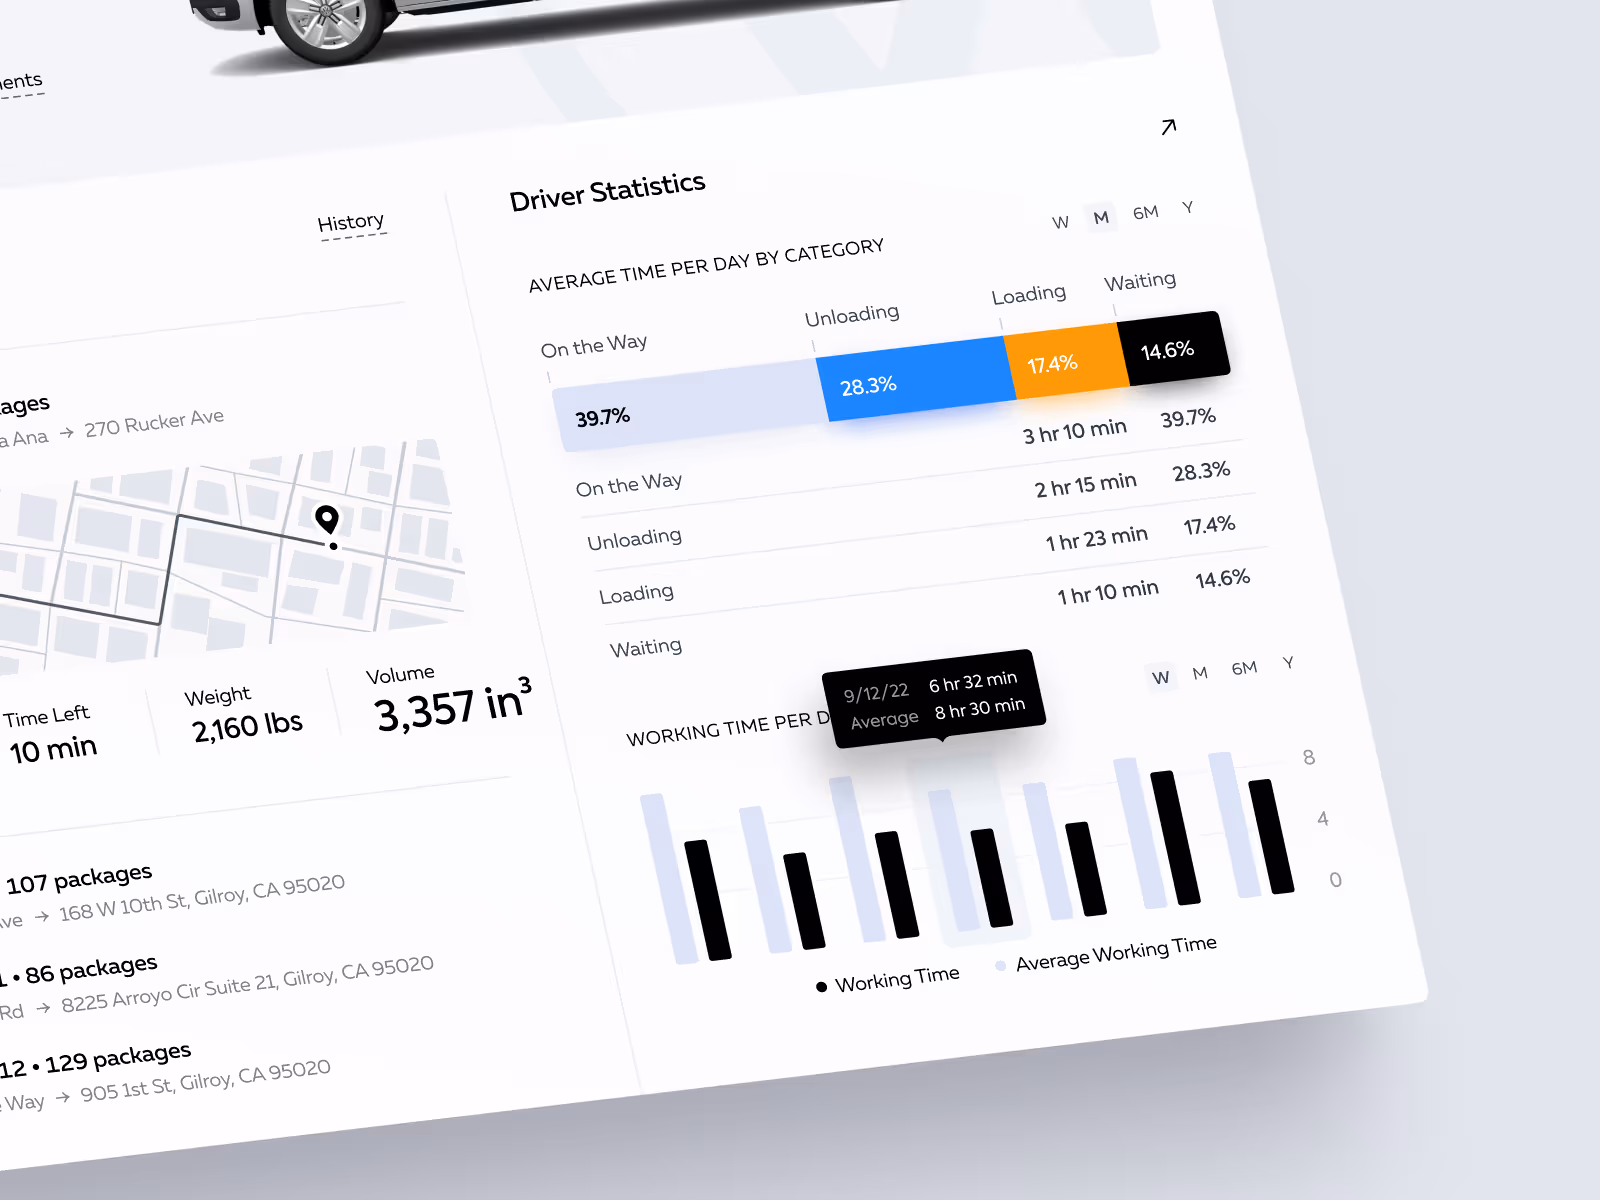
- Performance data is grouped by time. We used daily, weekly, and annual statistics to separate immediate workload from longer-term performance review. That gives the dashboard both an operational layer and a planning layer.
- Interface density stays controlled. We used clear grouping, spacing, and status hierarchy so the dashboard can carry many data points without becoming visually noisy. The goal is not minimalism for its own sake, but readable operational density.
- Status hierarchy supports faster decisions. Delivery work often depends on small status changes: workload pressure, delayed routes, incomplete cargo details, or driver availability. We gave these signals a clearer visual hierarchy so they can be noticed before they become larger operational issues.
Concept outcome
The result is a clearer dashboard direction for a logistics team before development starts. It shows which information needs to sit together, how much data can be visible at once, and which operational signals deserve priority.
It also gives product, operations, and development teams a shared reference for the first build. Route monitoring, driver workload, vehicle and cargo details, and performance reporting can be planned as one connected system.
Need to shape a complex dashboard?
Tell us what your team needs to monitor, manage, or explain. We’ll help turn the product idea into a focused dashboard concept with a clear structure.